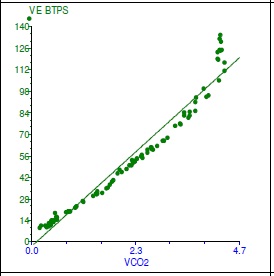
Exercise Minute Ventilation as a Function of Carbon Dioxide Output (VE/VCO2 slope)
VE versus VCO2 plotted on a scale of 30:1. This plot yields a linear relation until ventilatory compensation for metabolic acidosis steepens the plot. The slope of the linear part is steeper than normal with hyperventilation or an increase in the exercise physiological dead space/tidal volume ratio.
+ lesson 3 and lesson 4
Question: Is there an abnormal degree of V/Q mismatching?
Example of possible Disorders: Lung disease, pulmonary vascular disease, heart failure
Marker for Abnormality:
P(A-a)O2 reduced;
P(a-et)CO2 increased;
Vd/Vt abnormal relationship;
Ve/VCO2 at AT high


